Results of multiverse analysis to study the effect of red meat on all-cause mortality
Wang Y, Pitre T, Wallach JD, de Souza RJ, Jassal T, Bier D, Patel CJ, Zeraatkar D. Grilling the data: application of specification curve analysis to red meat and all-cause mortality. J Clin Epidemiol. 2024 Apr;168:111278. doi: 10.1016/j.jclinepi.2024.111278. Epub 2024 Feb 12. PMID: 38354868.
This figure shows the results of a multiverse analysis investigating the effect of red meat on all-cause mortality using data from the National Health and Nutrition Examination Survey (NHANES).
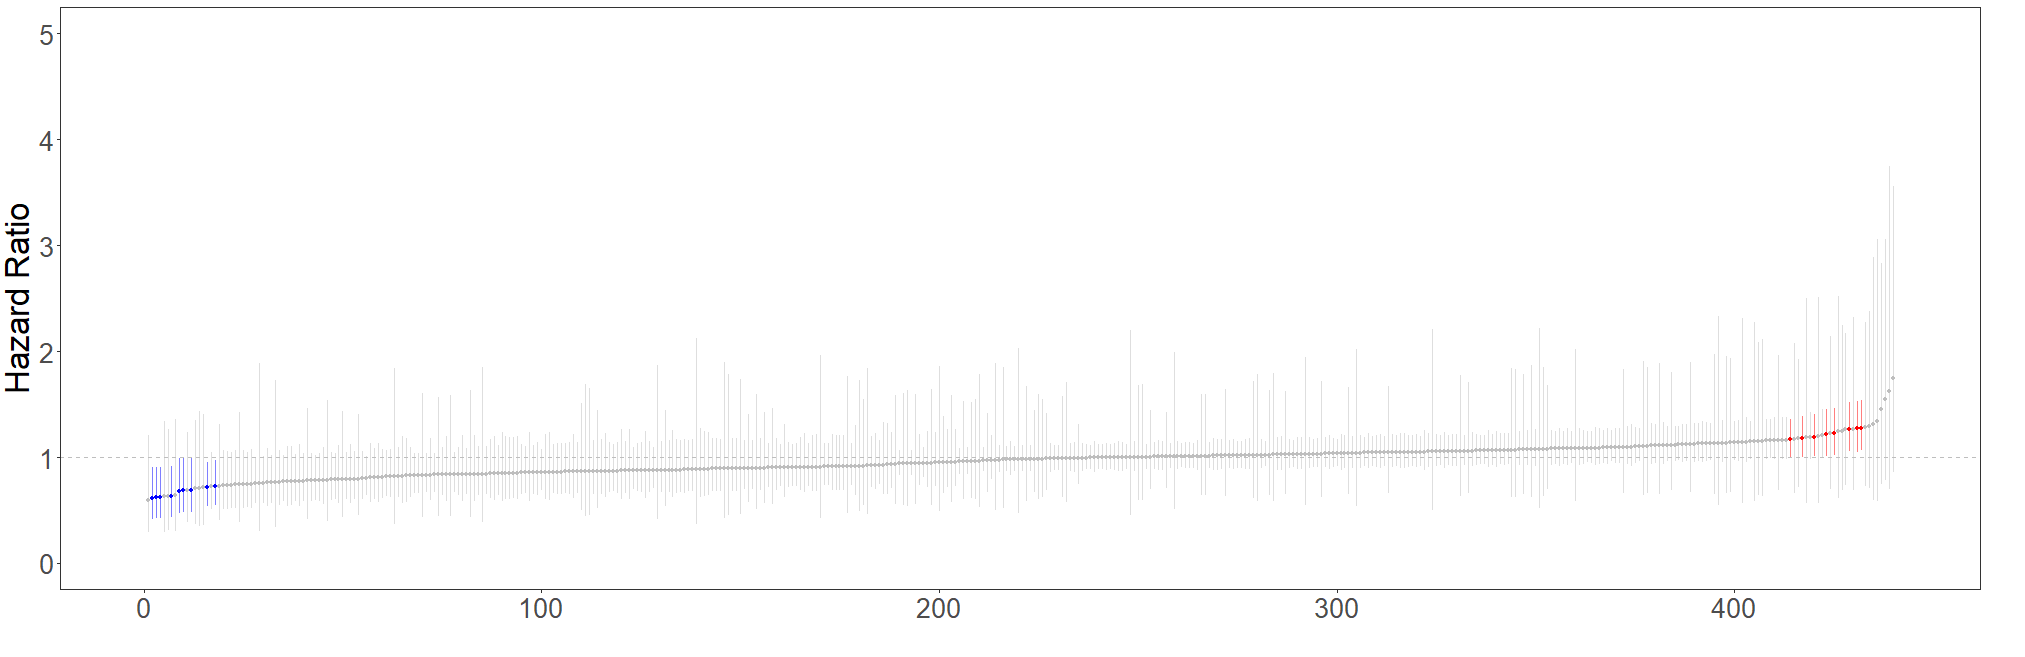
The x-axis shows ~450 unique analyses. The analyses all varied according to several characteristics: stratification variables, choice of covariates, and methods for adjusting for energy intake.
The y-axis shows the hazard ratio associated with a 100 g/day increase in intake of red meat on all-cause mortality.
Each point represents the results of one unique analysis.
The results are ordered according to the direction and magnitude of effect. Vertical lines represent 95% confidence intervals.
Points in red and blue are statistically significant and suggest a negative (red meat increases mortality) and positive (red meat reduces mortality) effect, respectively.
The multiverse analysis showed a median hazard ratio of 0.94 [interquartile range 0.83 to 1.05]. Of all specifications, only 5% were statistically significant—a proportion that is consistent with chance.